

Baseball IQ Weekly Recap (9/04- 9/12)
Baseball IQ Weekly Recap (9/04- 9/12)

Happy Sunday everybody. It’s hard to believe we’re already 45 games into the 60 game season. Next week I’ll share some visualizations on how the standings have moved around so far in the season, and how the playoff picture will look heading into the final stretch.
On to the weekly recap.
News from Around The League
MLB launched Film Room, a search engine for MLB clips going back to 1929. It has over 3 million videos. Check it out here, it’s fun to play around with.
The Nationals are off to a slow start in 2020. They had a similarly slow start in 2019, before turning things around roughly 50 games into the season and going on to win it all. That’s not going to be possible with the pandemic season only being 60 games long. FiveThirtyEight discusses the Nationals’ 2020 hopes here, and how the shortened season could be hiding good teams with poor records here. I highly recommend the second of these articles.
Wednesday was Roberto Clemente Day. Several Puerto Rican players wore no. 21 to honor Clemente’s legacy.
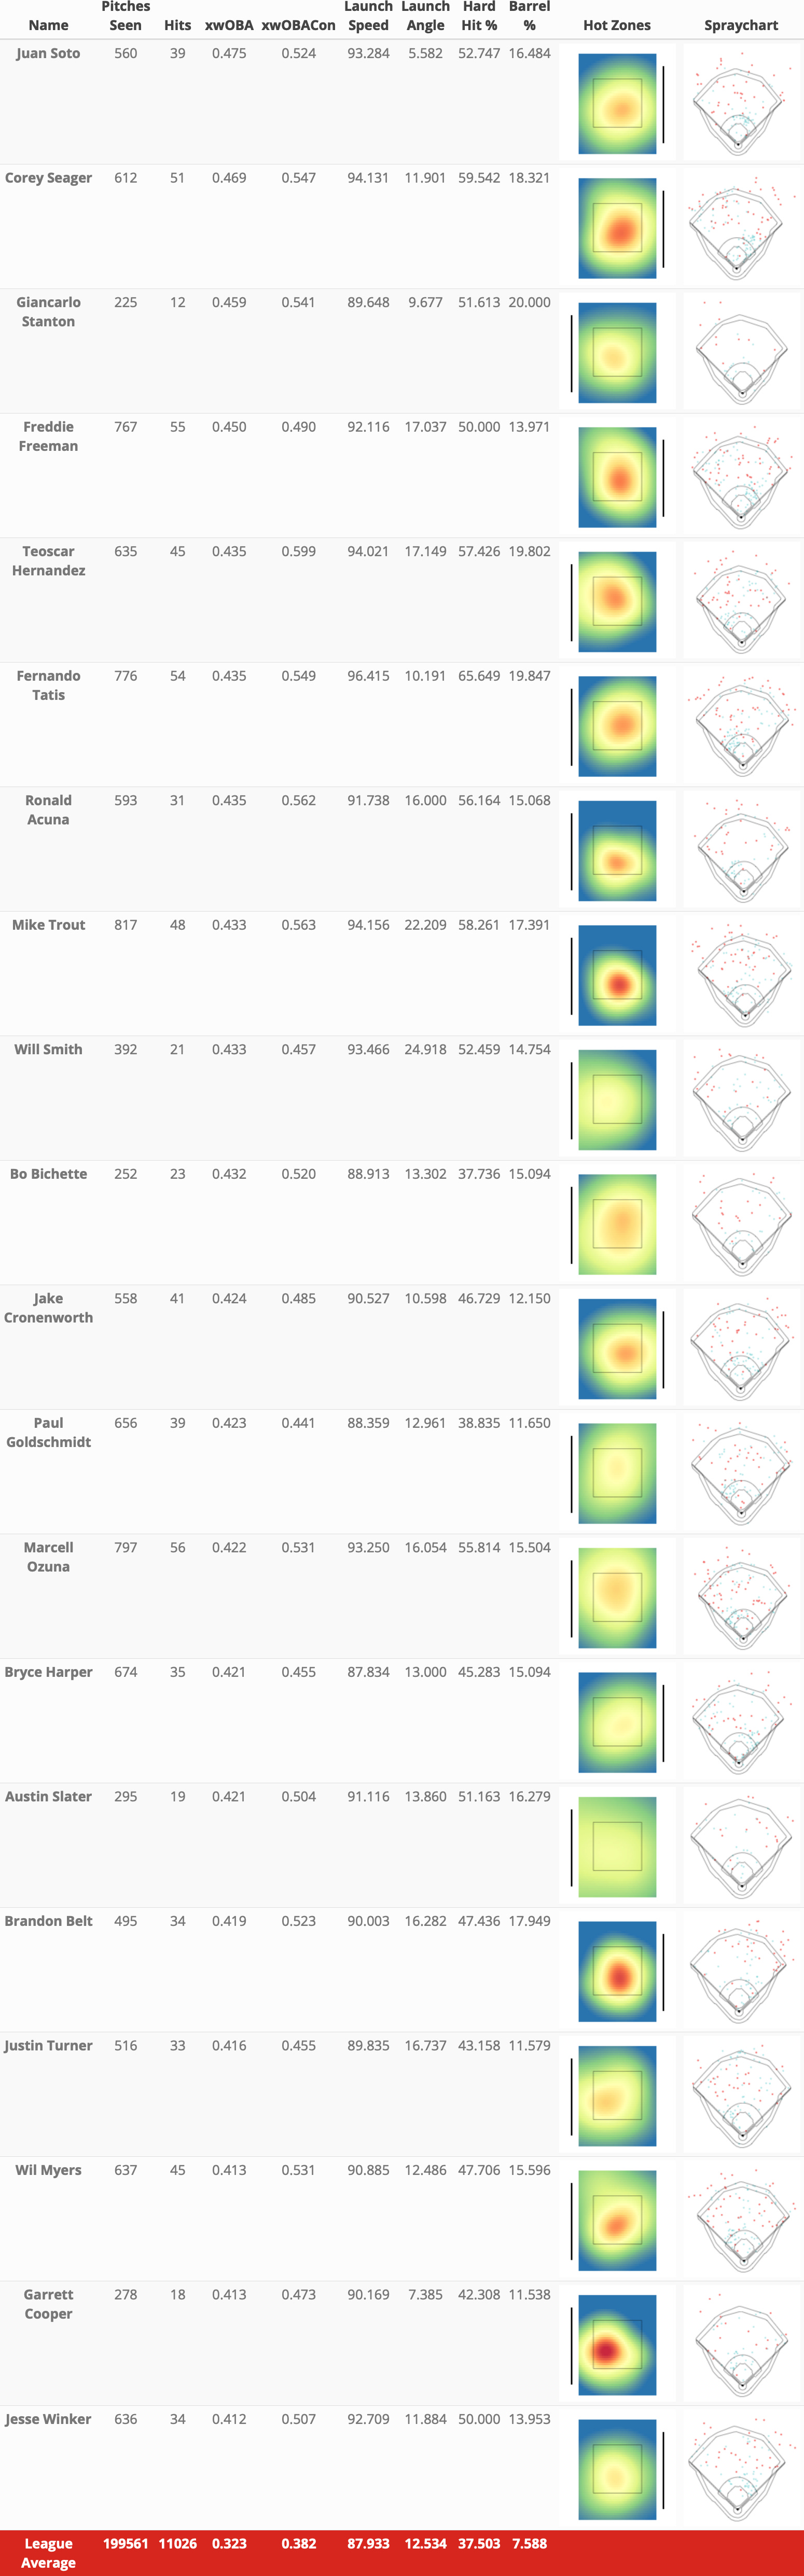
League Leaders
Season-to-date, sorted by xwOBA. Don’t recognize some of these statistics? Check out this glossary.
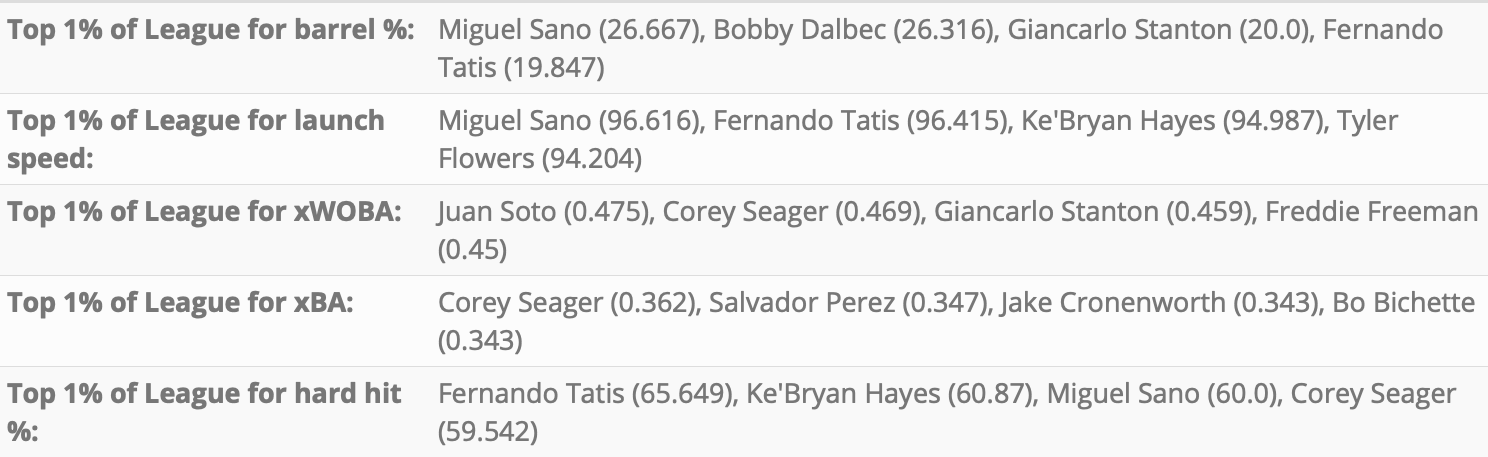
Top 1% of Batters for Select Stats
Season-to-date Statcast metric leaders (top 1% of the league)
Longest Hits This Week (in Ft.)
Sean Murphy, 464 (video)
Carlos Corea, 461 (video)
Adalberto Mondesi, 458 (video)
Ronald Acuna, 453 (video)
Marcell Ozuna, 453.0 (video)

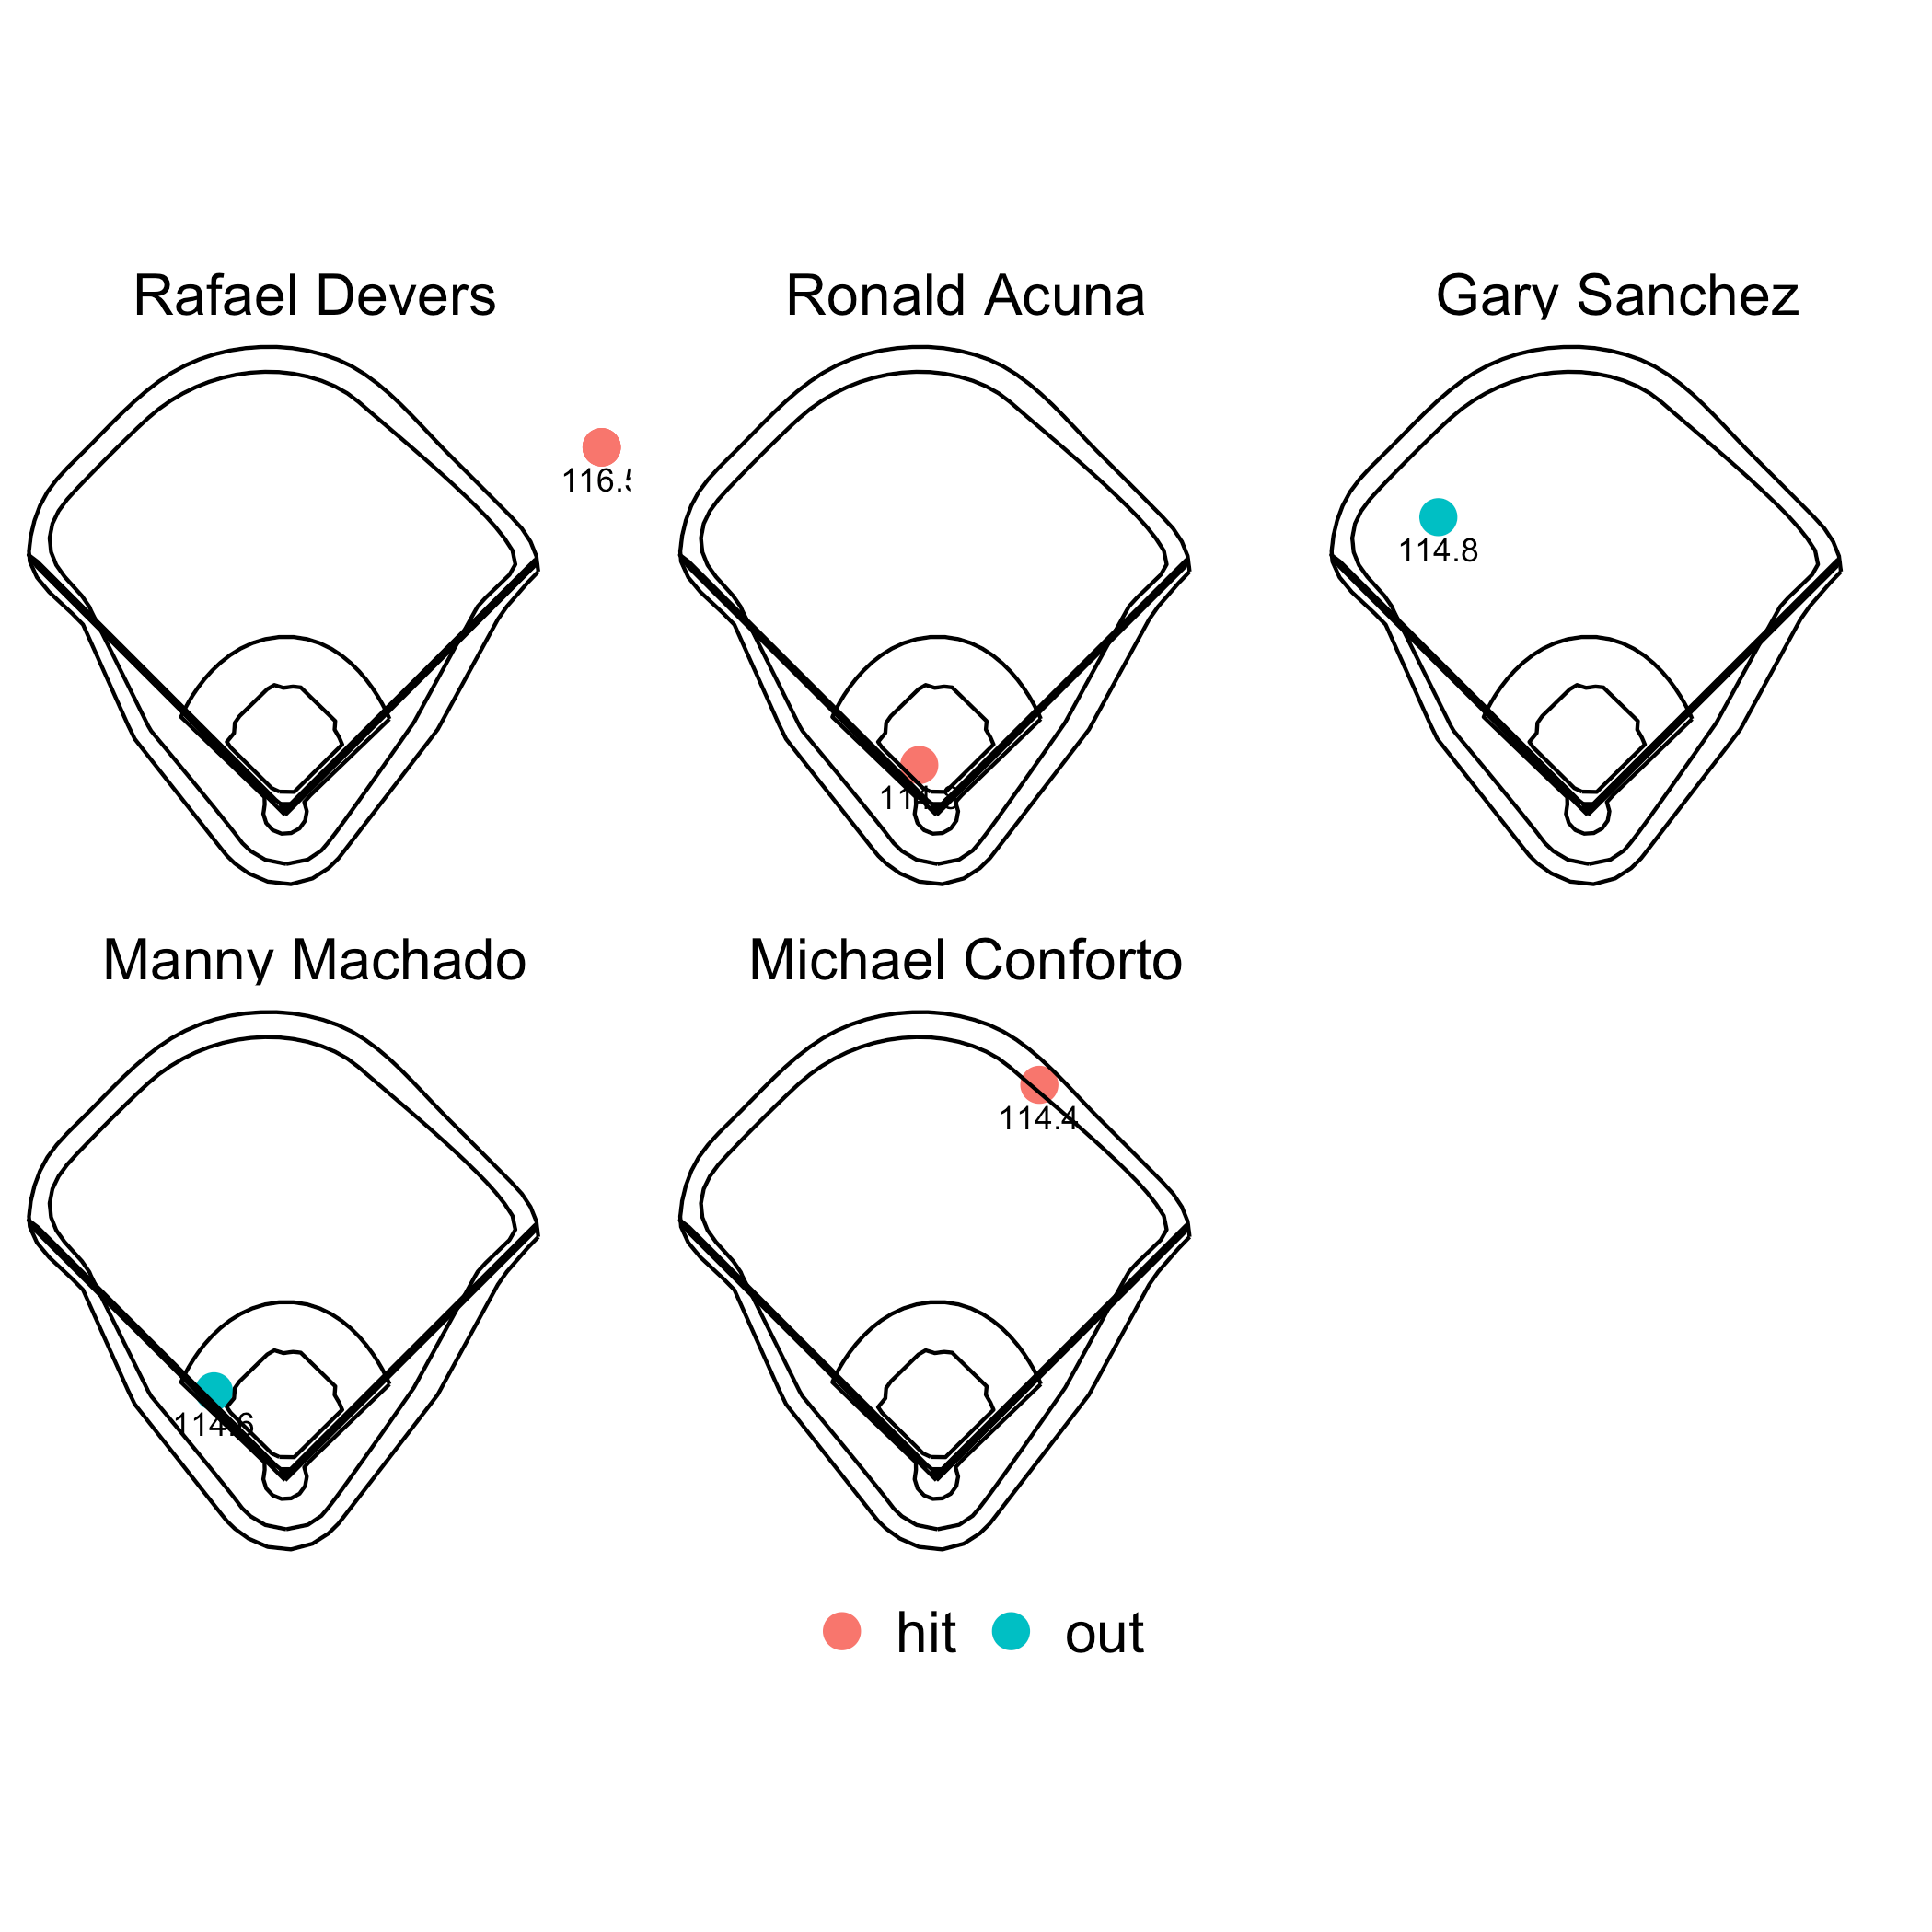
Hardest Hits This Week (in MPH)
Rafael Devers, 116.5 (video)
Ronald Acuna, 114.8 (video)
Gary Sanchez, 114.8 (video)
Manny Machado, 114.6 (video)
Michael Conforto, 114.4 (video)
Best Games This Week (By Total xwOBA)
Adam Duvall, ATL vs. MIA 2020-09-09 (box score) *
José Abreu, CHW vs. DET 2020-09-12 (box score)
Marcell Ozuna, WAS vs. ATL 2020-09-11 (box score)
Ronald Acuna, ATL vs. MIA 2020-09-09 (box score) *
Tyrone Taylor, DET vs. MIL 2020-09-09 (box score)
*The Braves scored 29 (!) runs on the Marlins this week. This game feed is a thing of beauty or disgust depending on which side of that you fall on.

This chart uses xWOBA to account for good or bad luck based on fielding and other factors.
Great Tweets


Book Club
I’m currently working my way through The Book: Playing the Percentages in Baseball, by Tango, Lichtman, and Dolphin. I highly recommend it for a primer on sabermetric research. This week I read chapters 1 and 2. Here’s the tldr version of this section:
Chapter 1: Toolshed
This chapter introduces some foundational tools for baseball research. The short version of these tools and methods is that:
Every base/out state can be described in terms of its expected run value. For example, a team with players on first and second and two outs, on average, scores an additional 0.466 runs before the end of the inning.
Every event in baseball can also be described in terms of the number of additional runs it creates by the end of the inning it happened in. For example, an inning containing a home run ends with on average 1.94 additional runs.
The difference between an the additional runs scored from an event and the run value of its base/out state is the event’s run value, or how many runs the event creates, independent of the context of its base/out state.
For example, a sac. bunt has a high run value (1.03) because it happens in highly leveraged game states, but the base/out state it’s used in also has a high run value independent of whether the player sac bunts (1.05). So, the sac. bunt’s run value is actually slightly negative (-0.02). A triple, on the other hand, creates an average of 1.61 runs in base/out states that are on average worth 0.55 runs, giving it a high run value of 1.06.
These run values, weighted according to the game states they happen in, are used to create wOBA, or weighted on base average. wOBA is a catch-all statistic describing the run-value of a player’s offensive contributions. It’s sort of like a smart compromise between OBP and SLG: it applies greater weight to more valuable events (using run values instead of SLG’s more arbitrary weights), and it also rewards getting on base via events like walks or getting hit by a pitch.
The current formula for wOBA is this:

You can read more about linear weights, run values, and base/out states in this primer from FanGraphs.
Chapter 2: When You’re Hot, You’re Hot
This chapter studies the question of whether offensive hot streaks exist. The authors identify “hot” and “cold” streaks as 5-game stretches where a player is in the top or bottom 5% of the league in wOBA. They propose that, if hot streaks are “real” (that is, if they have any predictive power over future performance), then the games following the hot streak will have higher-than-expected wOBA.
The authors find that, while hot players perform slightly above their expected wOBA following a hot streak, and cold players perform slightly below expectation, the predictive power of these streaks is very small, to the point where it’s probably not that significant in practical terms. They find that the effect of being “hot” is a +0.004 change in wOBA, and the effect of being “cold” is -0.006.
In short, if an announcer declares a player is “hot,” you shouldn’t think much of it. Regression to the mean is a powerful thing.
I’m working through a replication of this research with more modern data, so I’ll hopefully have more detail to share on this topic soon.
Thanks for reading this far. Have any feedback on the structure or content of this newsletter? Reply to this email and let me know! Also, don’t forget to subscribe and share with the baseball fans in your life.
Pssst. This is a free newsletter. You can help support my work by buying a copy of The Book using my Amazon affiliate link.